
Alpha Strategy
Live trades on DiscordAll session long· It works while you sleep
It finds, enters and manages its own MNQ trades, and stops on your rules.
Automated MNQ futures strategy for NinjaTrader 8, with a day profit and loss limit, streak stops and a forced flatten.
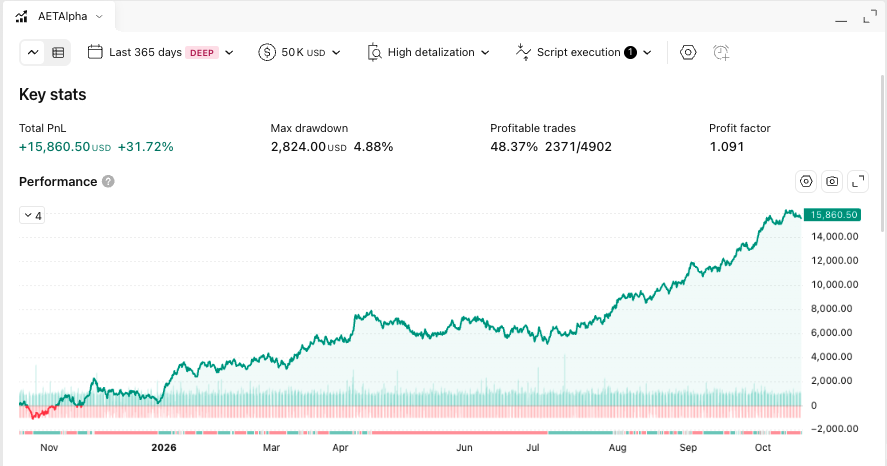
Backtest · Oct 2025 – Oct 2026 (1 year) · 1 MNQ per trade, no day limits · TradingView strategy tester, the last 365 days, run 16 Oct 2026, $0.50 a side and 1 tick of slippage per fill
Two ways to measure drawdown
Max drawdown · TradingView's figure
The deepest fall from the highest closed balance to the worst point of an open trade, so losses inside the day count. An intraday trailing drawdown counts this way, Apex's for example. That kind of limit also follows open profits up, so on such an account the drawdown can run deeper than this figure.
End-of-day drawdown
The deepest fall in the balance from one day's close to a later day's close: swings inside a day are not counted. An end-of-day trailing drawdown counts this way, Lucid's for example, where the limit moves only with each day's closing balance.
An example from this backtest
1. Highest close
15 Apr 2026
+$7,818.50
2. Lowest close after it
7 Jul 2026
+$5,423.50
−$2,395 over 59 trading days
3. Back above the high
30 Jul 2026
+$7,818.50 or more
That close-to-close fall of $2,395 is the end-of-day drawdown. It built up over 59 trading days, 34 down and 25 up, not in one session: the worst single day of the year was −$809.50, and no day gave back more than $673.50 after being up. TradingView's $2,824 is the same slide, measured to the worst point of an open trade.
Firms change their rules, and they differ by account: check yours.
Backtest at a glance
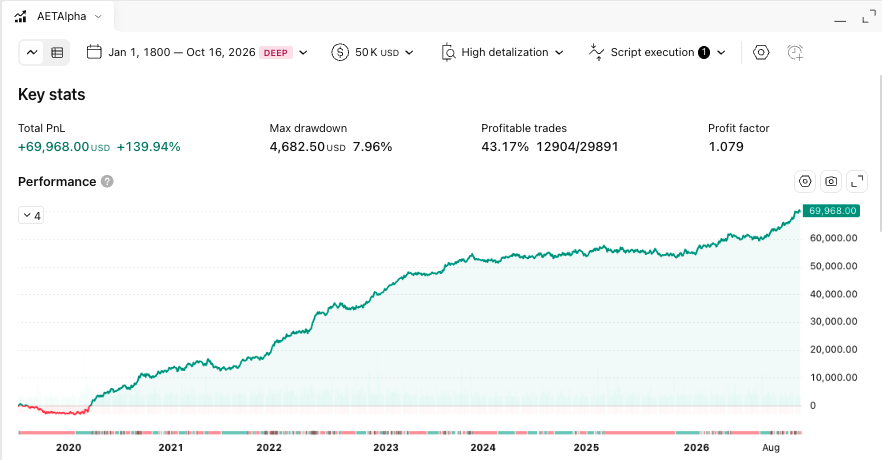
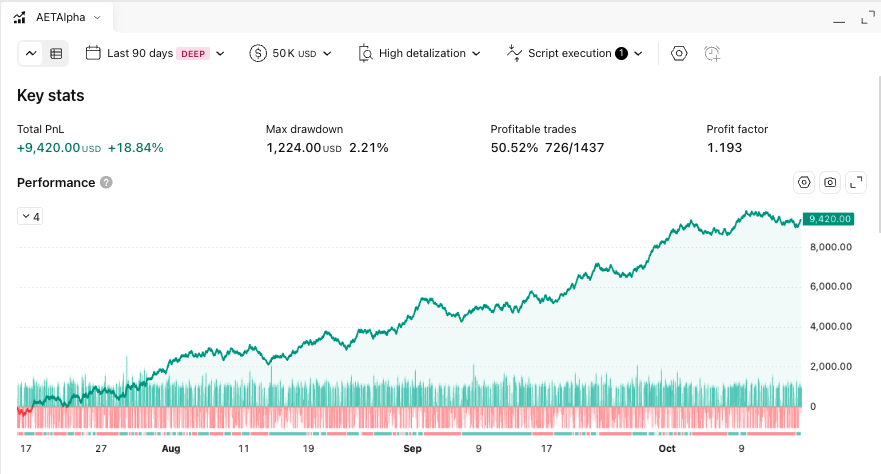
| To 16 Oct 2026 | Entire history | Last 365 days | Last 90 days |
|---|---|---|---|
| Net profit | +$69,968.00 | +$15,860.50 | +$9,420.00 |
| Profit factor | 1.08 | 1.09 | 1.19 |
| Max drawdown (TradingView) | $4,682.50 | $2,824.00 | $1,224.00 |
| End-of-day drawdown | $4,150.00 | $2,395.00 | $1,103.00 |
| Winning trades | 43.2% | 48.4% | 50.5% |
| Trades | 29,891 | 4,902 | 1,437 |
How it trades
Fully automated: it finds its trades, places a protective stop with every entry, and manages each trade to its exit. You choose the limits it trades inside.
Your controls
Contracts and instrument
How many contracts, on MNQ, or on NQ from the MNQ chart.
Day profit and loss limit
No new trade for the rest of the day once either is reached.
Day P&L on unrealized
Counts the open trade too, for firms that trail on the unrealized peak.
Streak stops
Done for the day after a run of wins or losses you choose.
Force flatten time
Closes any position at your firm's cut-off, New York time.
On-chart dashboard
Status, licence, the day's trades and your limits at a glance.
Telegram alerts
Every trade with its P&L and the day's, a lost connection, a day limit and the stop, sent to your own Telegram bot.
What you need
Test conditions
More backtest views
Also in All-Access
The same subscription unlocks every strategy.
Risk disclosure
Futures trading involves substantial risk of loss and is not suitable for every investor; you can lose more than you deposit. Backtest results have inherent limitations: they do not represent actual trading, are prepared with the benefit of hindsight, and may not reflect the impact of liquidity, slippage or other market factors. No representation is made that any account will or is likely to achieve results similar to those shown. Past performance is not indicative of future results. AlgoEdgeTrade provides software, not investment advice. Full risk disclosure